© 2026 The DeFi Report. All Rights Reserved.

Hello readers,
Gold is up 39% YTD vs just 19% for BTC.
The last time Gold showed strength against BTC in a bull market was in 2020. In the first half of the year, Gold was up 17% vs 27% for BTC.
The second half of 2020? BTC ripped 214% vs 7% for Gold.
Which begs the question:
Are we setting up for a similar outperformance for BTC today?
In this week's report, we break down everything you need to know about Bitcoin’s relationship with Gold.
Disclaimer: Views expressed are the author’s personal views and should not be relied upon as investment advice.
The DeFi Report is powered by BIT Digital, the leading global platform for high-performance computing infrastructure and one of the largest ETH treasury firms. NASDAQ: BTBT
Let’s go.
What drives the price of gold?

Data: The DeFi Report
The chart above tells us that Gold is inversely correlated with real interest rates (based on month-over-month changes in returns and changes in the 10-year real rate).
Put simply:
When real rates fall (nominal yield minus inflation shrinks), gold tends to outperform.
When real rates rise (yields move higher relative to inflation, gold tends to struggle (since gold doesn’t have a yield).
With that said, the relationship has decoupled of late, with gold rising along with real rates — a move that may have been catalyzed by the US cutting Russia out of SWIFT in February of ‘22.
The current R² value of .156 means that 15.6% of gold’s price action over this period can be statistically explained by moves in real interest rates.
We are now entering a regime where real rates are poised to drop — a historically favorable setup for gold. For investors, this suggests that gold momentum could continue as inflation expectations remain steady above 2% while nominal yields decline due to the Fed's easing.

Data: The DeFi Report, FRED
Similar to its relationship with real interest rates, gold has historically maintained an inverse correlation with the U.S. Dollar Index.
When the dollar drops, gold tends to rise (current regime).
When the dollar strengthens, gold often comes under pressure.
The R² of .106 indicates that about 10.6% of gold’s price action over the period can be statistically explained by moves in the dollar.

Data: The DeFi Report, FRED
Unlike gold, Bitcoin shows no meaningful relationship with the 10-year real interest rate.
At times, BTC has risen as real rates fell. At other times, the opposite has been true. The lack of consistency shows that BTC’s price action is not driven by the same macroeconomic factors that influence gold.
The R² of .002 confirms this — real rates explain almost none of BTC’s returns.
Data: The DeFi Report, FRED
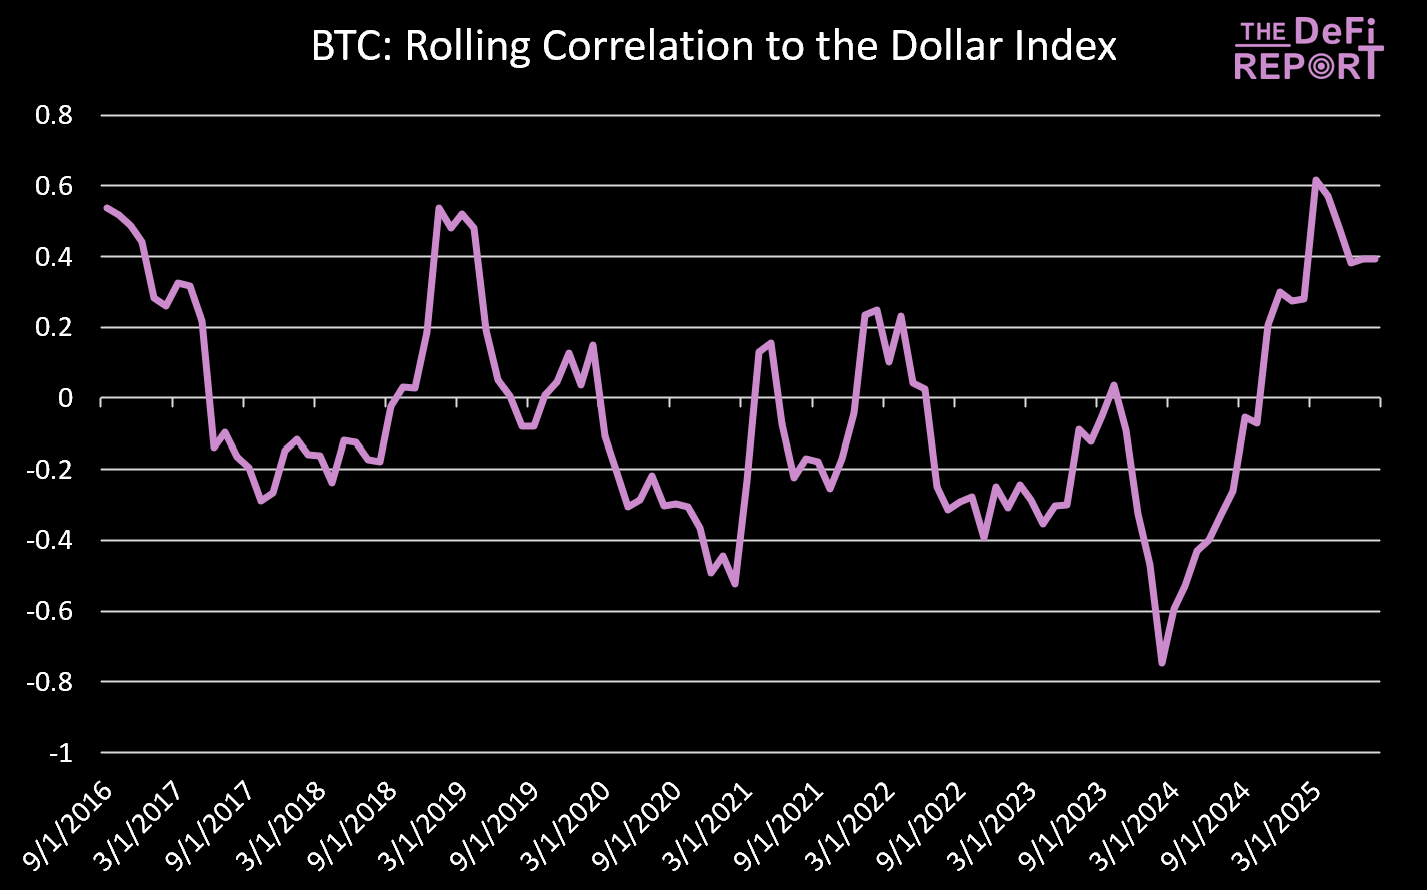
Bitcoin’s price action also shows no consistent relationship with the U.S. Dollar Index.
At times, BTC has moved inversely with the dollar (rising when the dollar weakens), while at other times it has risen alongside dollar strength. This inconsistency highlights that BTC is not driven by the same currency dynamics that influence gold.
The R² of .011 reinforces the point — the dollar explains just 1% of BTC’s returns.
Unlike gold, which is often viewed through the lens of dollar strength or weakness, Bitcoin operates on a different set of drivers: adoption cycles, liquidity flows, onchain reflexivity, and other idiosyncratic factors/narratives.
Its lack of correlation to the dollar strengthens the case that BTC is emerging as a distinct asset class, not just a “digital version of gold.”

Data: The DeFi Report
Bitcoin shows a much stronger positive correlation with the Nasdaq compared to macro drivers like real rates or the dollar.
Since 2017, the relationship has been consistent, with an R² of 0.089, meaning about 8.9% of BTC’s price action can be statistically explained by moves in the Nasdaq.
For context, gold’s R² with the Nasdaq over the same period is just 0.006 — less than 1% of gold’s returns are tied to tech equity performance.

Data: The DeFi Report
During the 2017 bull cycle, Bitcoin and gold showed a weak correlation.
The R² for the period was just 0.033, meaning gold explained about 3.3% of BTC’s price action from 2017–2018.

Data: The DeFi Report
Based on the rolling 30-day correlation, Bitcoin and gold showed a slightly stronger relationship, particularly in 2020 when both assets rose together.

Data: The DeFi Report
The correlation has weakened so far this cycle.
The R² for the period is .015 — meaning that gold explains just 1.5% of BTC’s price action this cycle.
As demonstrated, the correlation between BTC and gold is quite weak.
What about beta? Does BTC act like a “levered bet” on gold?

Data: The DeFi Report (monthly)
The answer is mixed. It certainly played that role in 2017, 2019, 2020 and 2023.
Meanwhile, BTC price action moved firmly in the opposite direction as gold in 2015 (a down year for BTC), 2018 (another down year for BTC), and 2021 (a year of significant gains for BTC).
Gold bugs are on cloud nine, with the asset outperforming BTC YTD (39% vs. 19%).
It’s up 102% since 1/1/23, and the gold mining sector is doing even better (GDXJ, VanEck’s Junior Gold Miner ETF, is up 122% YTD).
We’ve even seen some crypto-native investors adding gold to their portfolios.
But if you own BTC, do you really need gold in the portfolio?
We seek to answer that question in this section of the report.

Data: The DeFi Report

Data: The DeFi Report
BTC has historically had superior returns (and volatility) when compared to gold.
But how does it compare to gold’s returns when we adjust for risk?
Sharpe Ratio: measures how much return you earn for each unit of risk, measured by volatility (upside and downside).
Sortino Ratio: measures how much return you earn for each unit of downside risk. Unlike the Sharpe Ratio, it only counts bad volatility (i.e., volatility to the downside).

Data: The DeFi Report
As we can see, BTC tends to produce exceptional risk-adjusted returns during bull market years (2017, 2020, 2023). It also posts deeply negative sharpe ratios during bear market years (2014, 2018, 2022) due to its high volatility.
With that said, the Sharpe Ratio isn’t the best metric for BTC since it punishes all volatility (even to the upside).
That’s why we prefer the Sortino Ratio for BTC (which only punishes downside volatility).
We can see that BTC produces exceptional Sortino Ratios, an indication that its volatility is a feature, not a bug.
For context, a Sortino over 2.0 is considered excellent.

Data: The DeFi Report
Total returns with a 5% allocation since 1/1/18:
100% S&P 500: 149%
95% S&P 500 + 5% Gold: 152%
95% S&P 500 + 5% BTC: 199%
If the allocation of BTC and gold was 10%:

Data: The DeFi Report
Total returns with a 10% allocation since 1/1/18:
100% S&P 500: 149%
90% S&P 500 + 10% Gold: 155%
90% S&P 500 + 10% BTC: 253%
In our opinion, if you’re looking for outperformance and can weather some volatility, BTC is the superior asset. If the primary goal is capital preservation, gold certainly has a role to play.
In many ways, we see the benefits as generationally specific. Millennials and Gen-Z tend to prefer BTC for its asymmetric upside. Baby boomers may prefer gold for its role as an inflation hedge (less upside, but proven track record of capital preservation).
We’ve held gold in the past, but have shifted our hard money allocation to 100% BTC for the following reasons:
Asymmetric upside (BTC has very low global penetration compared to gold)
Superior scarcity (21 million hard cap, inelastic suppy response to demand)
Portability (BTC is a hard money asset that comes with a global payment network and accounting system)
Divisibility (gold cannot be easily divided or fractionalized)
Transparency & verifiability (golds circulating supply is unknown, verifying purity/ownership requires third-party trust)
Liquidity and 24/7, 365 market access
Demographics (BTC is global and has stronger brand equity with younger generations)
Financialization (BTC is increasingly being integrated into the global financial system)
It felt like “gold led Bitcoin” in the ‘21 cycle. However, it’s challenging to find conclusive evidence of the two assets being linked in a durable manner.
BTC is often referred to as “digital gold” due to its “hard money” features.
But it trades with almost zero resemblance to gold — which historically serves as an inflation hedge due to its negative correlation with the dollar and real rates.
Instead, BTC is emerging as an asset class on its own — driven by tech adoption, financialization, global liquidity flows, reflexivity, and adoption cycles.
Upgrade to finish reading the report.
Already a paying subscriber? Sign In.