© 2026 The DeFi Report. All Rights Reserved.

Hello readers,
Inflation is easing. Unemployment is rising. The yield curve is still inverted. And the Sahm Rule just triggered a recession warning.
What does it all mean for the crypto markets?
We’re back for our first macro + onchain data update in almost 3 months.
Disclaimer: Views expressed are the author’s personal views and should not be relied upon as investment, legal, tax, business, or any other advice. Please do your own research.
Let’s go.
Recession or blow-off top?
In this section, we’re going to run through a number of data points that we’re tracking as it pertains to the macro environment, and what it means for markets.
It’s on the rise and looks like it’s going to continue to rise into the first half of 2025:

Data: Cross Border Capital
Central banks around the world are turning dovish (less red in 2024 = more liquidity).

Data: Cross Border Capital
Finally, here’s a view of the net % of central banks that are tightening:

Data: Cross Border Capital
Takeaway: it appears that a coordinated easing campaign is underway amongst central banks globally, with the Fed expected to cut in September.
Below is the ISM, which measures conditions in the manufacturing sector such as new orders, production, employment, supplier deliveries, and inventories.
It appears to be bottoming.
As the business cycle bottoms, unemployment is rising (4.3%), and inflation is dropping (1.47% per Truflation).

Data: Macro Micro
Takeaway: When the ISM bottoms, it typically coincides with a recession (gray bars above). However, with the amount of fiscal spending coming from the treasury, we see no signs of recession — which we get to later in the report.
Here’s the net % of banks tightening lending standards in the US.
No recession in sight here as less than 12% of banks surveyed are currently tightening lending standards.

Data: FRED
Below are credit spreads:

Data: FRED
Takeaway: When spreads widen it’s an indication that it’s getting harder and more expensive for higher-risk companies to access the credit markets (a sign of financial stress in the system). Again, no sign of recession as credit spreads are near all-time lows.
After peaking in October of ‘22 at 112 (which coincided with the bottom in global liquidity), the dollar is now down to 101 on the DXY.
We’re expecting the downward slope to continue as the Fed shifts monetary policy, with the DXY dropping into the 90-95 range in ‘25.

Data: Market Watch
Takeaway: Further decline in the dollar could be supportive of hard assets such as Bitcoin and Gold. If Bitcoin does well, we expect altcoins and the crypto markets broadly to outperform traditional asset classes.
As noted, the Federal Government continues to spend money it does not have. In July alone, we racked up a $244 billion dollar deficit.

Data: US Treasury Department
Meanwhile, the projected annual budget deficit was recently increased to $1.8 trillion (!) from $1.6 trillion in June.
It’s hard to have a recession when the Treasury is pumping money into the economy like this.
Takeaways from Jerome Powell’s Jackson Hole speech:
Inflation: Powell expressed confidence that inflation has been successfully tamed, with the 2% target now in sight.
Unemployment: It seems evident that the Fed’s focus has shifted from fighting inflation to preserving a strong labor market as unemployment is up to 4.3% (3.8% in August 2023). Our assumption is that the Fed is watching the Sahm Rule closely — which triggers recession when the 3-month moving average of the unemployment rate rises .5% or more compared to its lowest point over the prior 12 months. The July reading was .53%.
Impending Rate Cuts: Powell all but guaranteed a rate cut in September. Meanwhile, the futures markets are pricing in 9 cuts and a terminal rate of 3% by the end of 2025.

Takeaway: If Bitcoin was able to trade at $73k with a 5.5% Fed Funds rate, what do you think Bitcoin will be trading at when rates are cut to 3%? We think BTC will go higher, with volatility along the way.
The recessionistas are out in force these days, but it’s tough to see any sign of a recession on the horizon.
What we do see are signs of fiscal spending, monetary debasement, and increasing global liquidity — which should be supportive for risk assets such as crypto as we move into the latter part of the year and into 2025.
Now, let’s hop onchain and see what investor behavior is telling us.
As always, we use BTC to gauge what’s happening onchain.
Why?
Bitcoin is still the granddaddy driving the rest of the crypto markets. Until that changes, we plan to stick with BTC as our reference point.

Data: Glassnode
We saw Bitcoin’s long-term holders, i.e. “smart money,” book some profit late in Q1 and into Q2 as the yellow line above dropped off. The market has chopped and consolidated for about 5 months now (including two 20% + drawdowns and one 30% + drawdown).
Over the last few weeks, we’ve been observing initial indications that long-term holders have stepped back into the market as buyers.
Takeaway: Smart money thinks we’re going higher?

Data: Glassnode
Bitcoin’s MVRV (market value to realized value — which is a proxy for the cost basis market value of all bitcoins in circulation) reached a level of 3 (moderately overbought) in March.
We hit a similar level in mid-2019 before re-setting and ultimately going much higher (7.5) at the peak of ‘21.
Today the MVRV Ratio sits at 1.6 — which is neither overbought nor oversold.
Will we see a repeat of 2019 with a bigger move later this year into Q1? Stay tuned as we share our concluding thoughts later in the report.

Data: Glassnode
Bitcoin’s realized price (yellow line above — a proxy for the cost basis of each bitcoin in the network) currently rests at $31k. As we can see from the red arrows, in past cycles the realized price made substantial moves:
In the ‘17 cycle, realized price rose over 1,000%
In the ‘21 cycle, realized price rose 242%
In the current cycle, we are up just 55%
The recent 55% move is in the range of what we saw in ‘19, followed by consolidation and ultimately a parabolic move in late ‘20 into ‘21.

Data: Glassnode
The chart above looks at the 30-day net position change of Bitcoin Miners in aggregate. The little green shoot noted above is telling us that Bitcoin Miners are accumulating more BTC than they are selling for the first time in nearly a year, a trend we’re keeping an eye on.
In conjunction with the German Gov’t dumping $2.5b of BTC in July, miners turning from net sellers to buyers could stabilize the market and create a foundation for the next leg up.
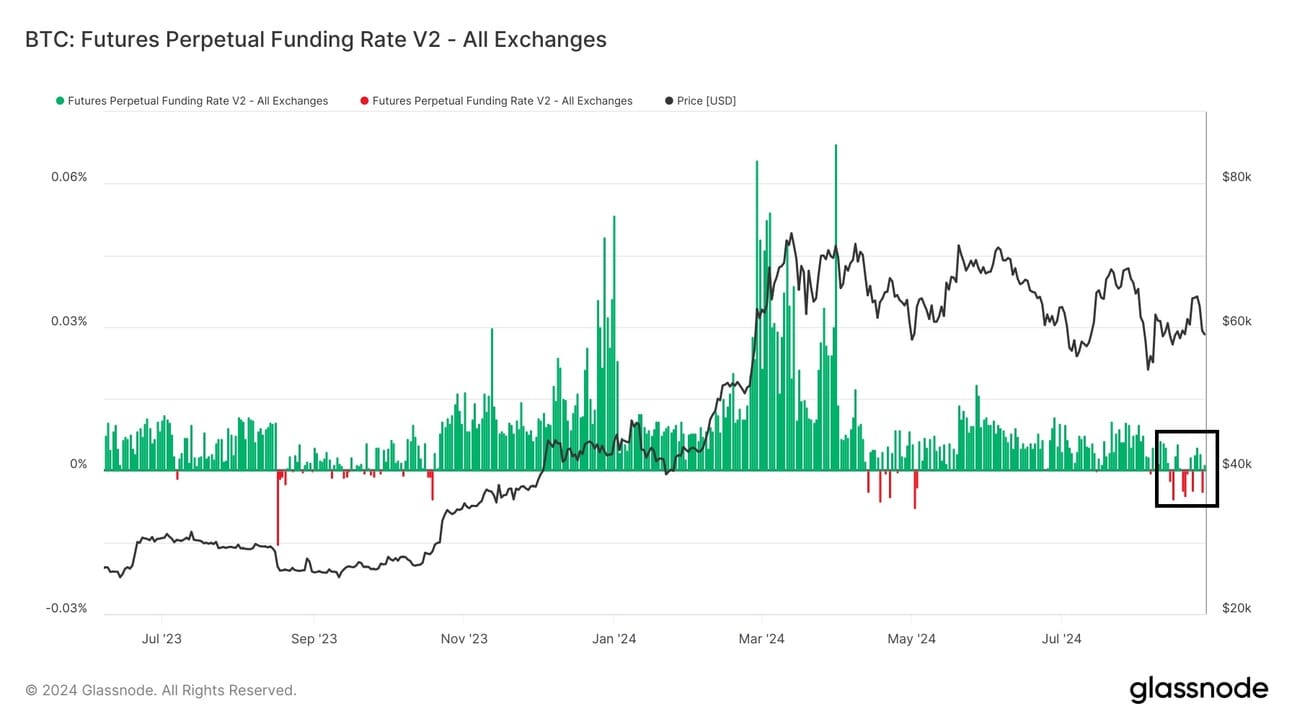
Data: Glassnode
Funding rates (the amount that longs pay shorts to keep positions open and vice versa) can give us an idea of sentiment (and the amount of leverage) in the market. As we can see, sentiment peaked late in Q1 (6.8% funding rate) and has actually flipped negative more recently.
For reference, the peak funding rate in the ‘21 cycle was 16.6%.
Takeaway: While it may seem contradictory, it’s healthy to see sentiment flip negative like this during a bull market. Markets cannot rise in a straight line forever. During consolidation, traders are chopped up, get impatient, and ultimately turn bearish — creating a setup for a short squeeze.
This is a necessary process that has to play out before we potentially see another leg of the bull run.

Data: Token Terminal
Aggregate stablecoin balances are just now getting back to the high-water mark established in late ‘21. We think this is part of the reason that Bitcoin has struggled to push through all-time highs.
There just hasn’t been enough liquidity in the system.
Forthcoming rate cuts and rising liquidity conditions point to stablecoin balances moving up and to the right, as investors potentially shift away from money market accounts — which currently hold nearly $6.5 trillion:

Data: FRED
We’d be remiss not to mention the number of large entities that have been selling lots BTC & ETH of late:
The German government sold $2.5b of BTC in June and July.
Jump Crypto sold nearly $400m of ETH in July and August.
Mt. Gox creditors have received about $3b to date, with an additional $5.8b left to be distributed (we’re assuming a lot of this is being sold as creditors are likely sitting on very large gains).
The court approved $12.7b FTX distributions to customers on August 9th, with all claims of $50k or less (98% of claimants) to be paid by October 9th.
Of course, this is all noise in the long run, but we think it has factored into the consolidation and chop we’ve seen through the summer months. As the selling tapers, a strong foundation for the next leg of the bull run could form.
In many ways, the move that we saw from Bitcoin in Q4 of last year into Q1 ($27k to $73k) looks similar to the rally we saw back in 2019 ($4k to $14k). Crypto natives got excited and assumed we were going back to all-time highs back in 2019. But the reality was that new users had not come into crypto at that time. It ultimately took a full year of chop/consolidation (and recovery from the Covid scare) before BTC broke through all-time highs on its way to $66k in Q2 of ‘21 — which coincided with rate cuts, monetary debasement, and an election cycle.
It was after BTC firmly broke through all-time highs that we saw an explosion of new users. The formation of countless DAOs. DeFi’s emergence. 10x growth in stablecoin issuance. The explosion of NFTs. “WAGMI” sentiment from crypto natives.
And laser eyes from Tom Brady.
If history were to repeat, this type of frenzy could play out later this year and into 2025.
What are the risks?
Recession? In parts of the economy such as commercial real estate, yes. But more broadly a recession is less likely due to fiscal spending.
A Harris victory in November might temper this cycle, but have little impact in the long run.
More fighting in Europe, the Middle East, or the South China Sea would likely roil markets (again, a short-term impact).
A significant correction in the traditional markets as the Fed shifts monetary policy due to recession fears. If this happened, Fed easing and rising global liquidity would ultimately buoy markets in the long run.
We’ll continue to monitor the data and let you know if we turn bearish.
Disclaimer: Individuals have unique circumstances, goals, and risk tolerances, so you should consult a certified investment professional and/or do your own diligence before making investment decisions. The author is not an investment advisor and may hold positions in the assets covered. Certified professionals can provide individualized investment advice tailored to your unique situation. This research report is for general educational purposes only, is not individualized, and as such should not be construed as investment advice. The content contained in the report is derived from both publicly available information as well as proprietary data sources. All information presented and sources are believed to be reliable as of the date first published. Any opinions expressed in the report are based on the information cited herein as of the date of the publication. Although The DeFi Report and the author believe the information presented is substantially accurate in all material respects and does not omit to state material facts necessary to make the statements herein not misleading, all information and materials in the report are provided on an “as is” and “as available” basis, without warranty or condition of any kind either expressed or implied.